Suprathermal Ions
Remnants of past energetic events
Suprathermal ions are particles with energies above the thermal solar wind but below fully accelerated cosmic rays. These remnant populations exhibit a universal spectral index of 2.5 that remains invariant across nine different elements and two full solar cycles, revealing a fundamental constraint on particle acceleration in the heliosphere.

Two decades of measurements converge on a single spectral slope of 2.5
Related Figures

Heavy ion abundances shift between CIR and SEP values with the solar cycle
Heavy element abundances in quiet-time suprathermal ions change systematically with the solar cycle.
Proves suprathermals are remnants from CIRs during solar minimum and CME-driven shocks during solar maximum

Nine heavy-ion species fall along identical power-law spectra
Despite spanning a factor of nearly five in atomic mass — from carbon (mass 12) to iron (mass 56) — every element produces essentially the same spectral shape during quiet times.
Shows all 9 elements following the same spectral slope

All heavy ion abundances follow power-law trends with Fe/C ratio
Fe/C serves as a sensitive single-number indicator of the overall heavy-ion enrichment state in quiet-time suprathermals.
Reduces the complex behavior of eight suprathermal elements to power-law relationships with a single enrichment indicator (Fe/C), revealing cyclic composition loops tied to solar activity phase

Suprathermal variability increases with mass-per-charge, matching GSEP trends
The variability of quiet-time suprathermal abundances increases systematically with mass-per-charge ratio across all solar cycle phases.
Connects suprathermals to their role as seed population for solar energetic particle events
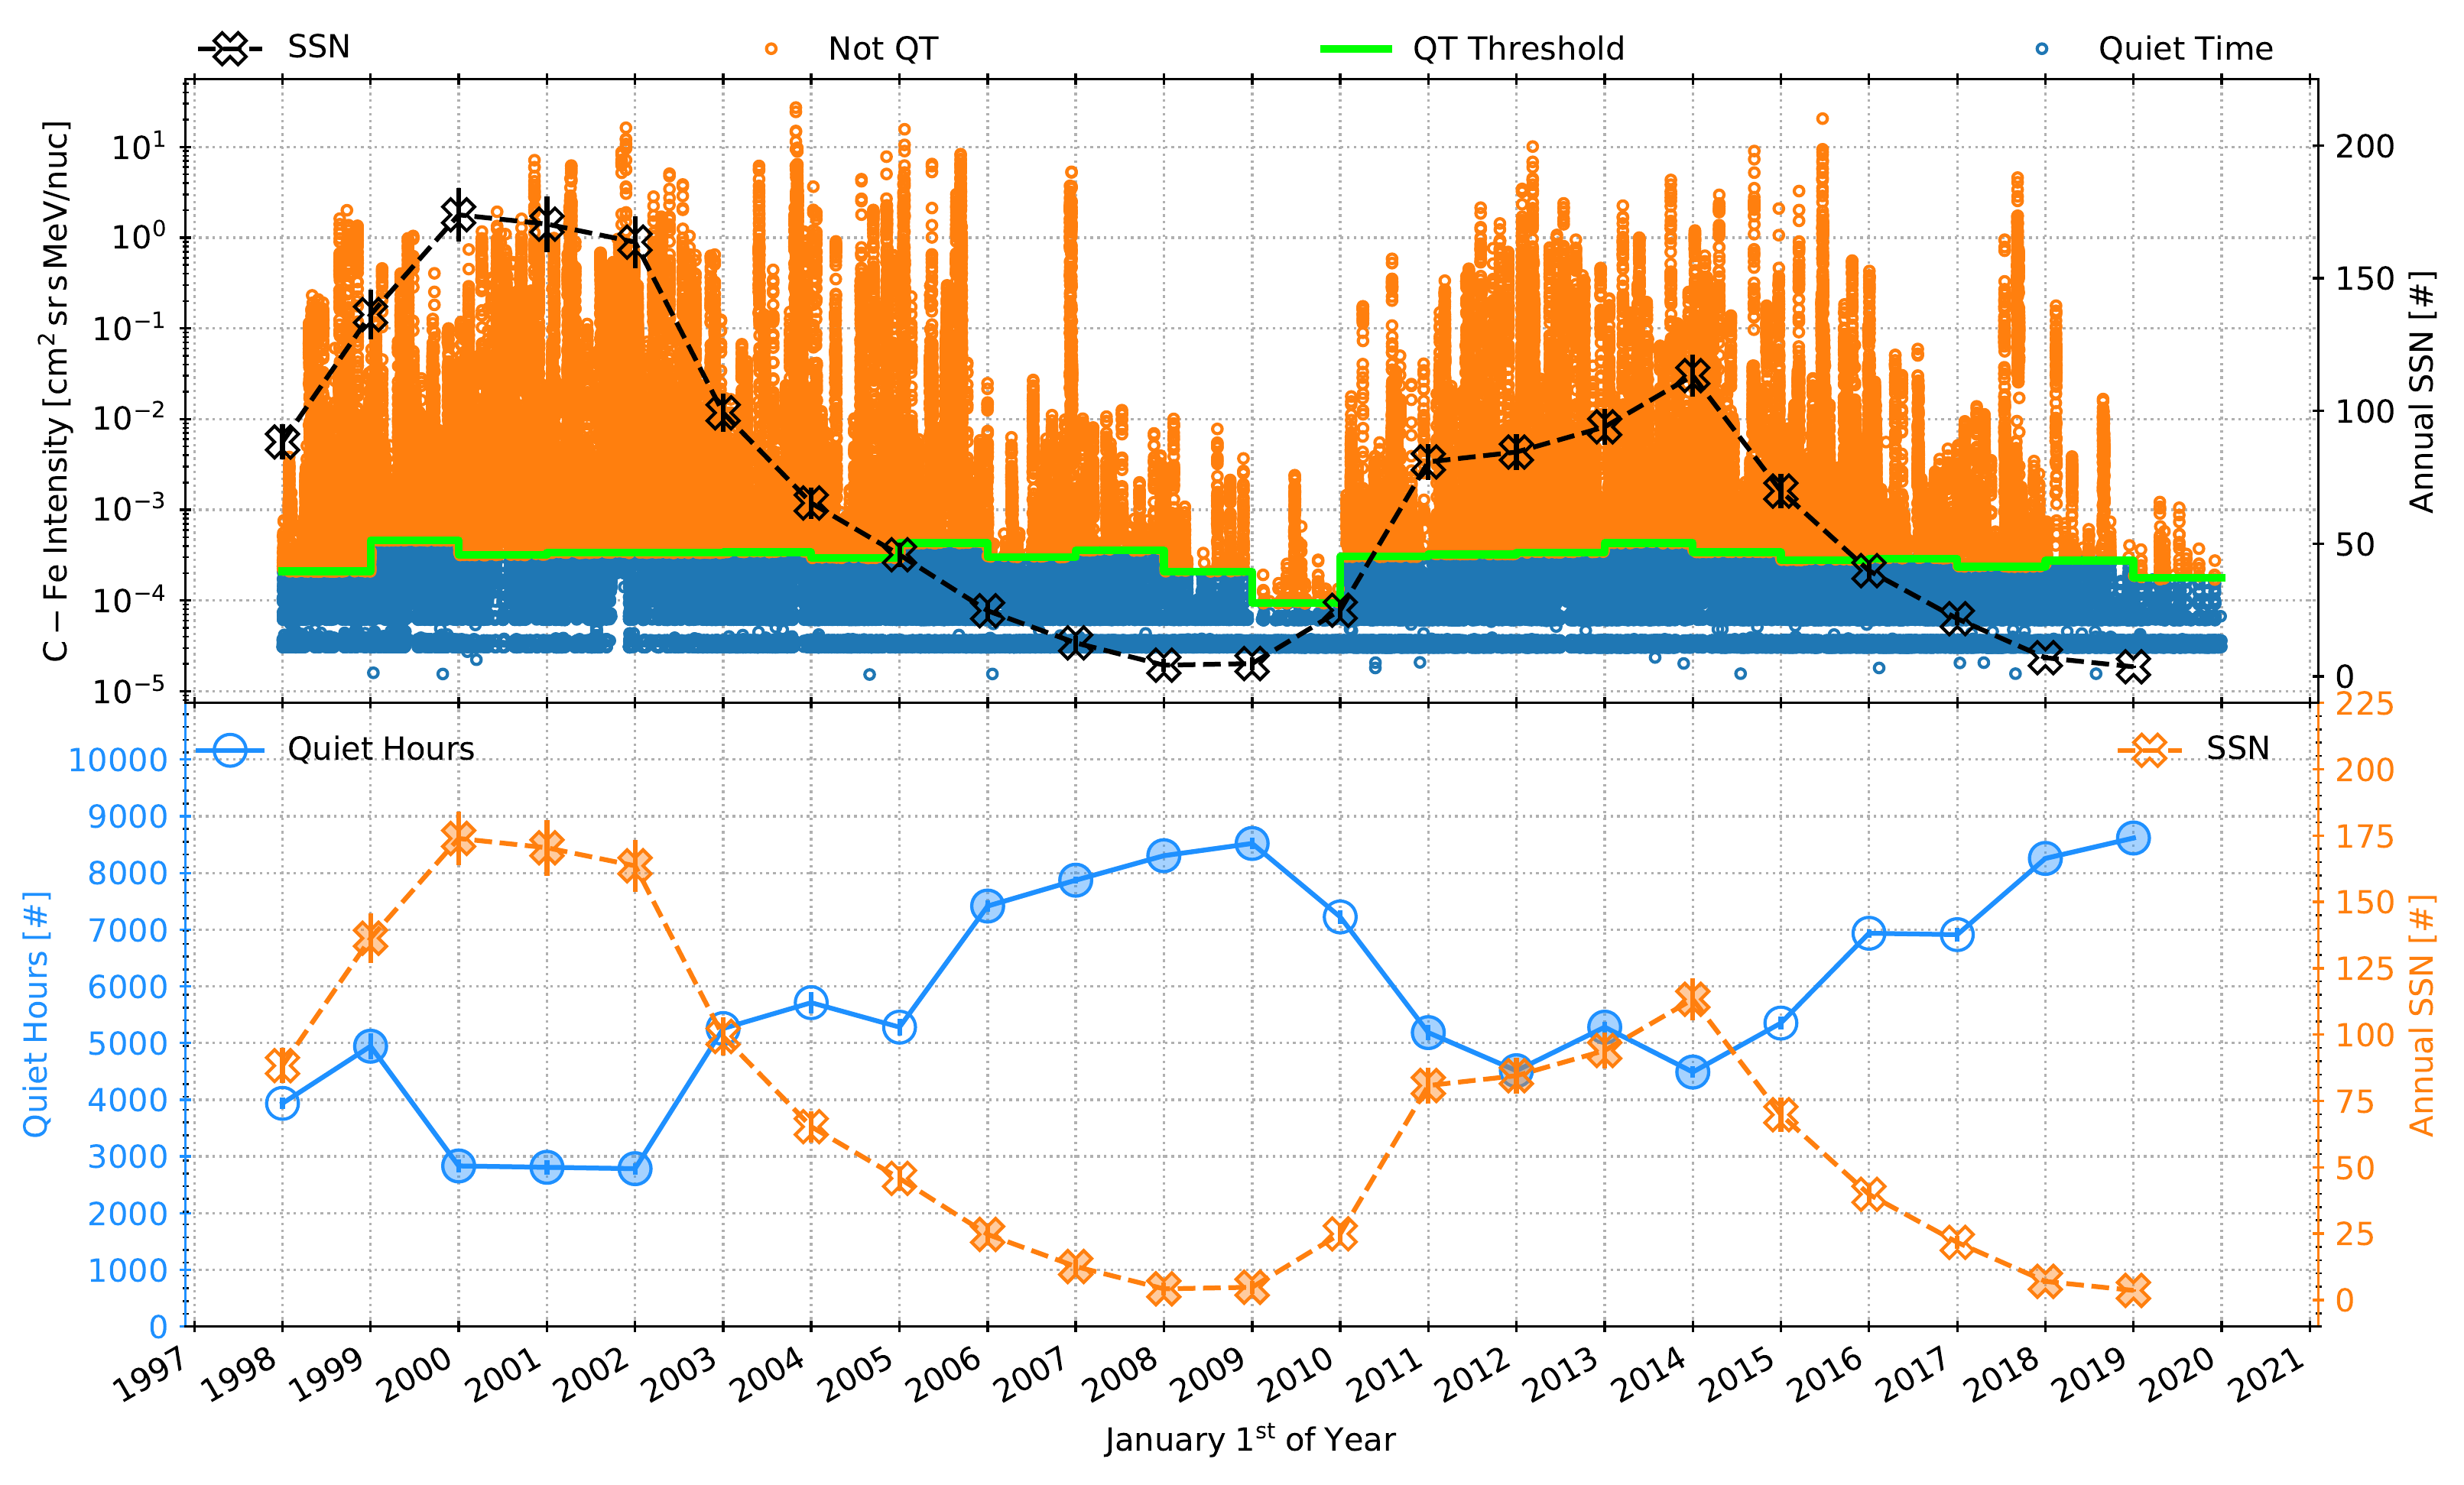
Quiet hours peak when sunspot activity drops to its lowest
The number of quiet hours strongly anticorrelates with sunspot number at a Pearson correlation of -0.95.
Confirms that quiet hours anticorrelate with sunspot number at -0.95, validating the quiet-time identification as physically meaningful and establishing the 22-year baseline for studying suprathermal composition evolution

Quiet-time thresholds remain consistent across two solar cycles
Despite spanning two complete solar cycles with dramatically different activity levels, the quiet-time thresholds cluster within a narrow range.
Validates that the quiet-time selection method produces consistent thresholds across two full solar cycles, ensuring that downstream suprathermal abundance measurements reflect real physical changes rather than methodological drift

Spectral slope holds steady as sunspot activity rises and falls
Over more than two decades, the oxygen spectral slope fluctuates around a value of roughly 2.5 without tracking the dramatic swings in sunspot activity.
Demonstrates independence from solar activity
See Also
Source
Quiet-time Spectra of Suprathermal Heavy Ions near 1 au in Solar Cycles 23 and 24
The Astrophysical Journal Letters (2024)
View Paper© 2024 The Author(s). Published by the American Astronomical Society. CC BY 4.0