Quiet hours peak when sunspot activity drops to its lowest
What We See
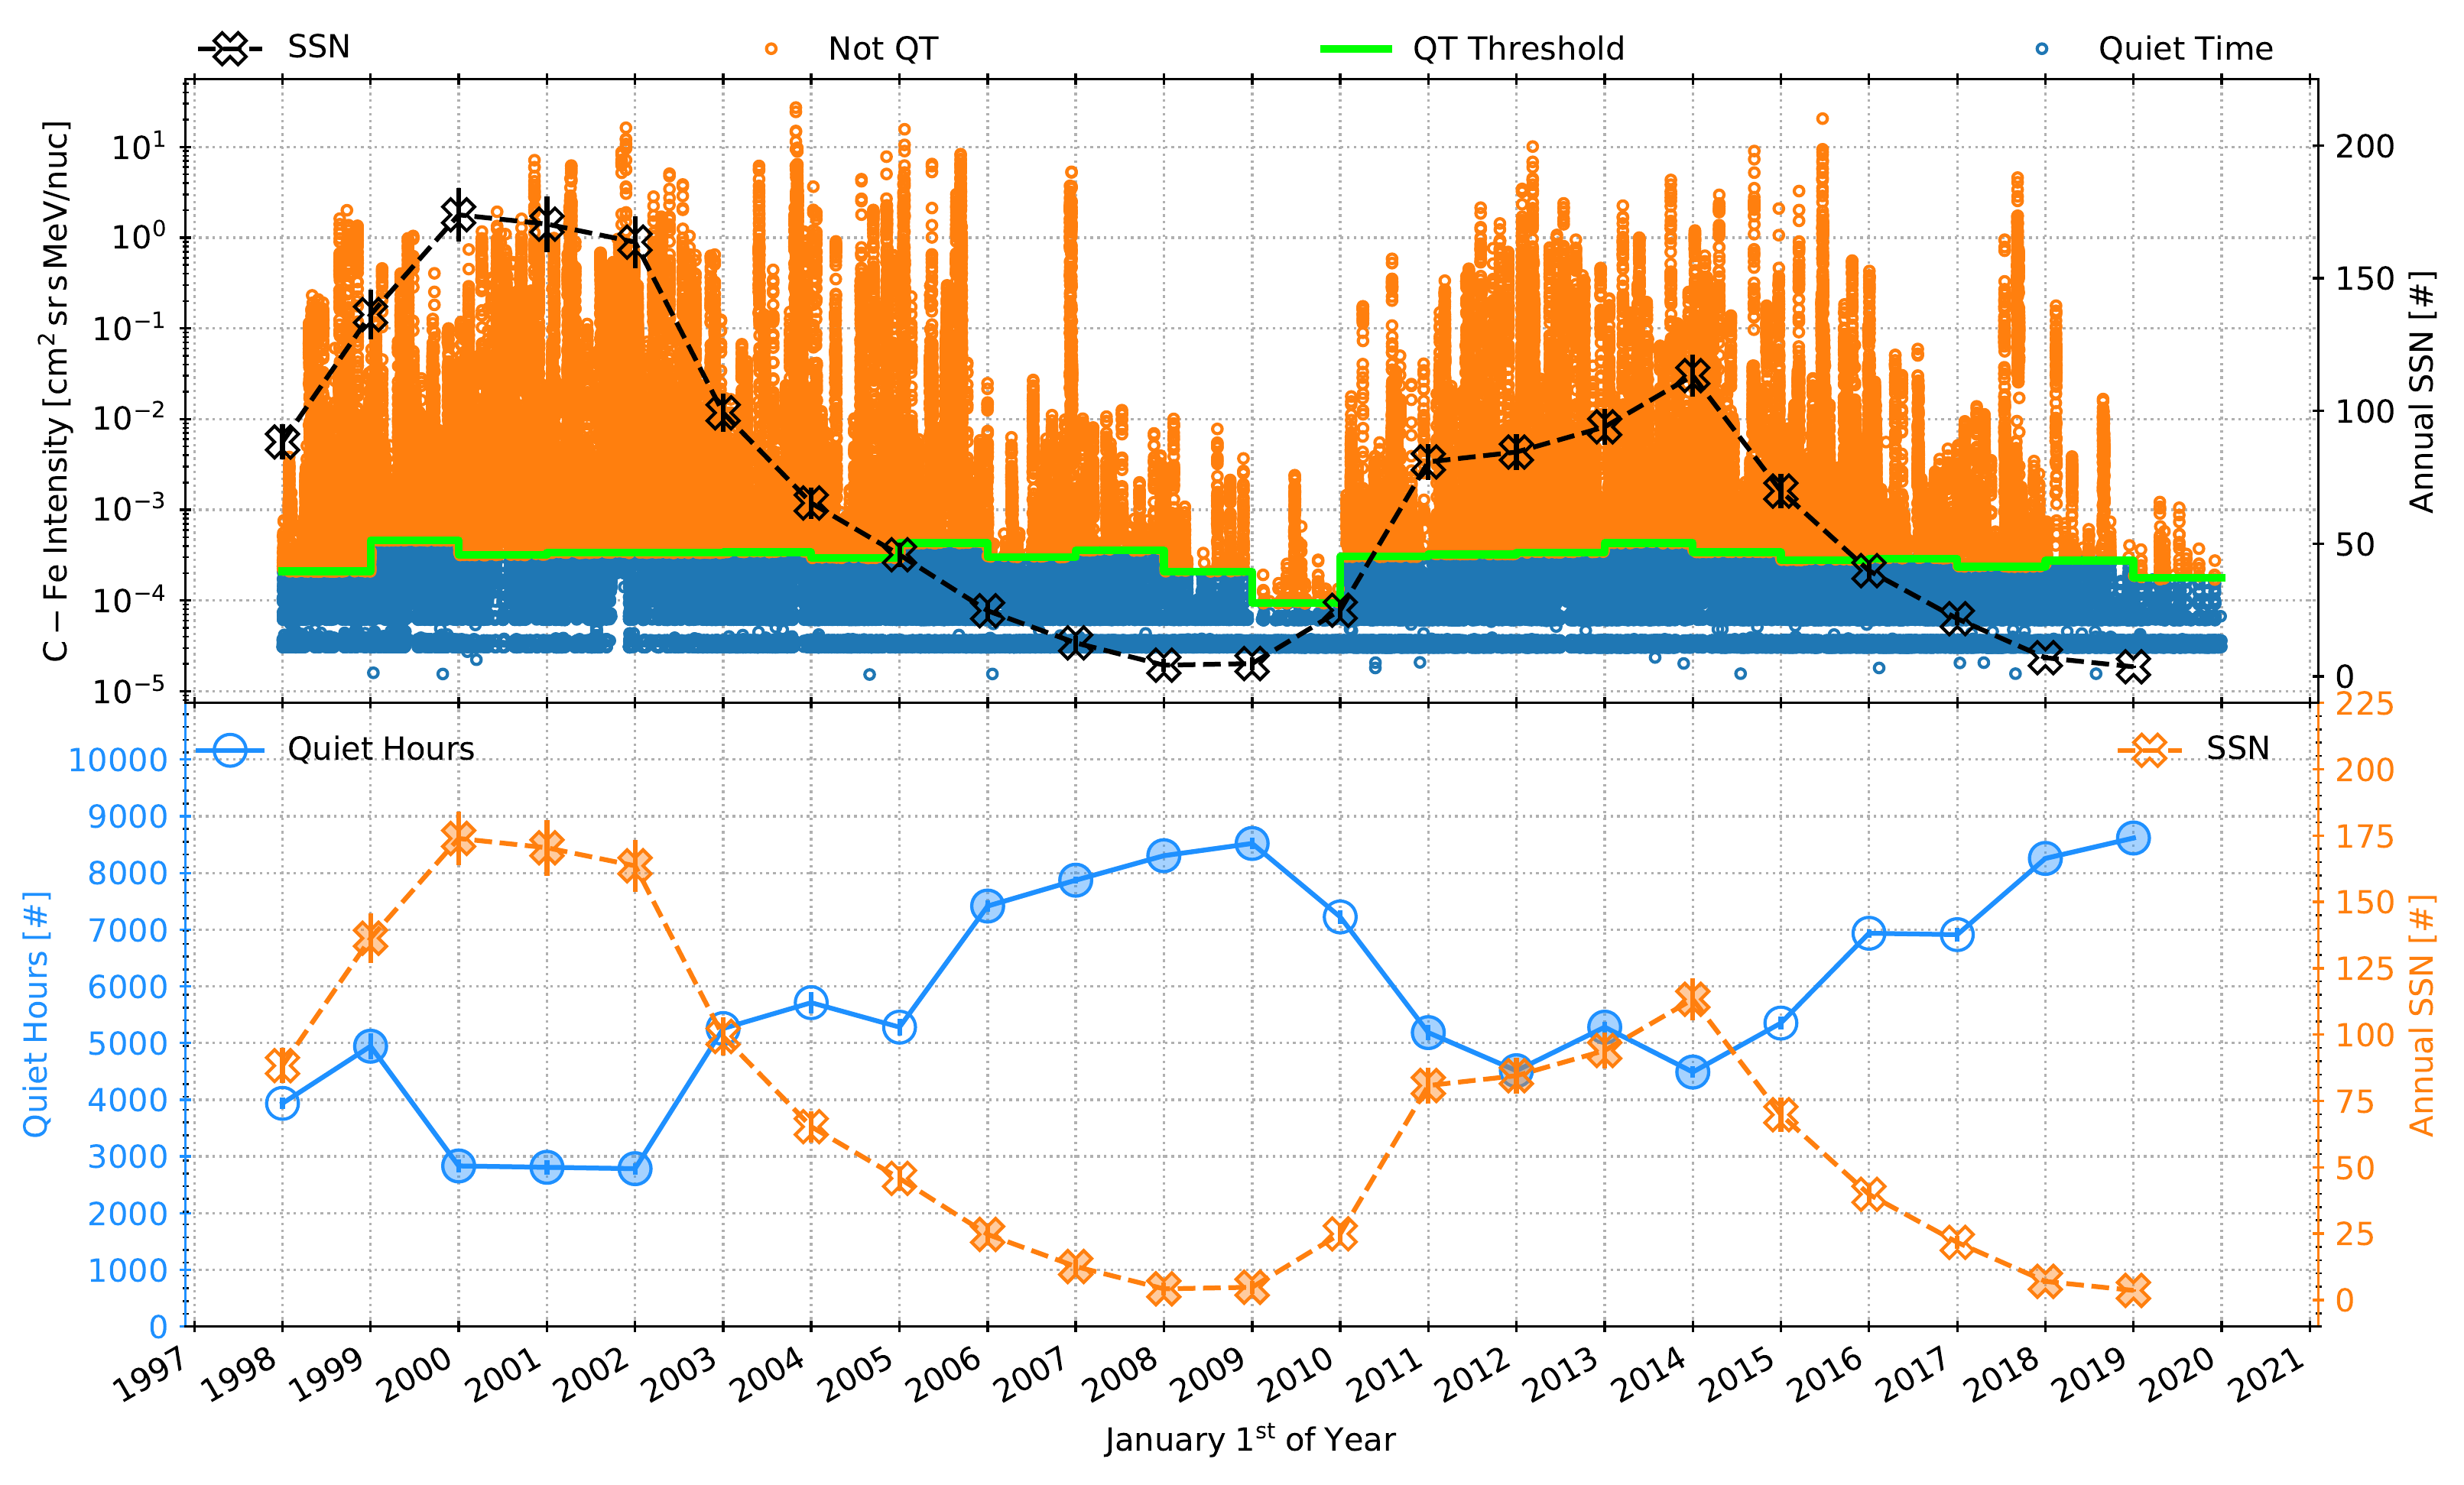
Two stacked panels spanning 1997 to 2021. The top panel shows a dense cloud of hourly particle intensity measurements on a logarithmic scale. Orange points (non-quiet times) form tall, spiky columns reaching above 10^-1 during solar maximum years, while blue points (quiet times) form a dense band near and below the green quiet-time threshold line around 10^-4. A dashed black curve traces annual sunspot number on the right axis, peaking near 2000 and 2014. The bottom panel plots annual quiet hours (blue circles connected by a line) against annual sunspot number (orange dashed line with X markers). The two curves mirror each other: quiet hours dip below 3000 when sunspots peak and rise above 8000 when sunspots bottom out around 2008-2009 and 2018-2019.
The Finding
The number of quiet hours strongly anticorrelates with sunspot number at a Pearson correlation of -0.95. During solar maximum, frequent flares and coronal mass ejections fill interplanetary space with energetic particles, leaving few truly quiet intervals. During solar minimum, these events are rare and quiet conditions dominate. The quiet-time threshold itself correlates only moderately with sunspot number (0.51), confirming that the method adapts to changing activity levels without being driven by them. Error bars from the threshold sensitivity test are typically smaller than the markers.
Why It Matters
This strong anticorrelation validates the quiet-time selection method against a fundamental expectation: solar activity controls how often interplanetary space is disturbed. If the method were picking up noise or artifacts, this clean anticorrelation would not appear. Having a reliable 22-year baseline of quiet-time observations, with the sensitivity to threshold choice shown to be negligible, enables studying how the composition of the energetic-particle seed population evolves across the solar cycle.
Appears In
Alterman 2023 ApJ 952 42 · fig 3